
")
")
")
Progress of signal strength during 24 hours, 16/04/2021
On websites about the reception of the British bundle from the position of 28.2°E, it is often said that the signal strength in our territory (the Czech Republic) fluctuates during the day, and therefore that the reception conditions are not very stable. I have also mentioned this phenomenon here in some articles on my website. However, I haven't seen any graph or data anywhere that shows how big the differences in signal strength actually are and how these changes in signal strength are spread out over time. This is not to say that such reports do not exist. Maybe I'm just too lazy to search. And maybe it's more interesting for me to try to measure something like that and create it myself. So I decided to give it a try.
Of course, I had no intention of sitting at the receiver for 24 hours and manually writing down the signal strength values in order to create a corresponding graph from the data obtained in this way. That's why I first started writing a program that would collect the necessary data automatically. In the end, this was achieved and so I have a finished prototype that already has more or less the intended functionality. It communicates with receivers equipped with Enigma2 and Open WebIf environments. It still can't do a lot of things, but when I get it to a slightly more usable state, I'll write a separate article about it and offer it for download.
Of course, I couldn't wait any longer, so I tried out my prototype. I first chose the FreeSport HD program on the Astra 2E transponder. This program isn't quite the strongest, so its signal strength fluctuates, but it's strong enough to be catchable most of the day with my 270cm dish. I recorded the signal strength value every minute.
Here I should make one more note about the measurement methodology. The satellite receiver is not a measuring device and therefore the measured values cannot be taken as correct in the sense of an absolute value. However, it is possible to proportionally compare repeated measurements that are burdened with a similar measurement error. But this does not apply to signals for which the receiver's tuner does not achieve lock. Measurements below this limit are extremely unstable and "pulsate" within seconds from their actual value to zero. I don't know why the receiver does this, the signal certainly doesn't fluctuate that fast and the measurement error is huge. In order to somehow eliminate this shortcoming, I do not take just one reading of the signal strength at the time of measurement, but I measure the signal strength 10 times for 5 seconds and save the highest measured value in the graph. Of course, this is only a partial solution, and the resulting graph significantly degrades it in the area of weak signals. It would take a real measuring device. But I started to try the measurement anyway.
Astra 2E, 11427 MHz, V, 8/9, 29500, QPSK
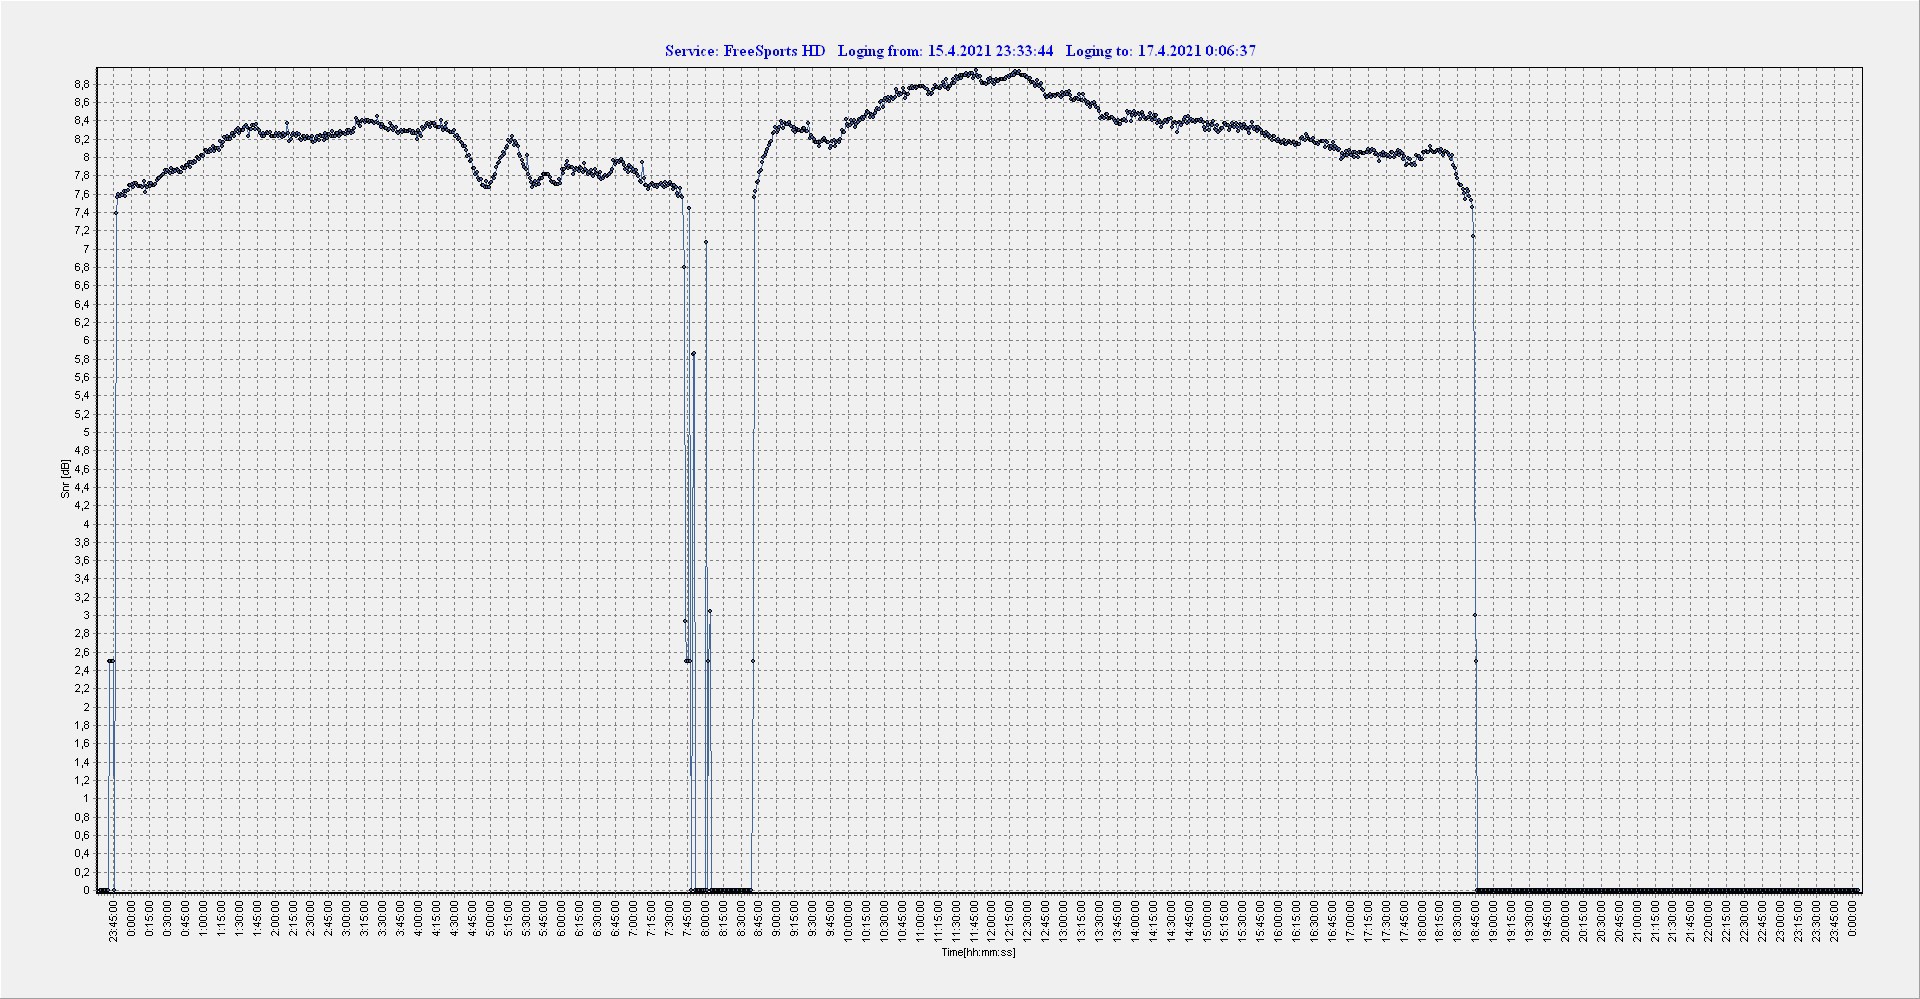
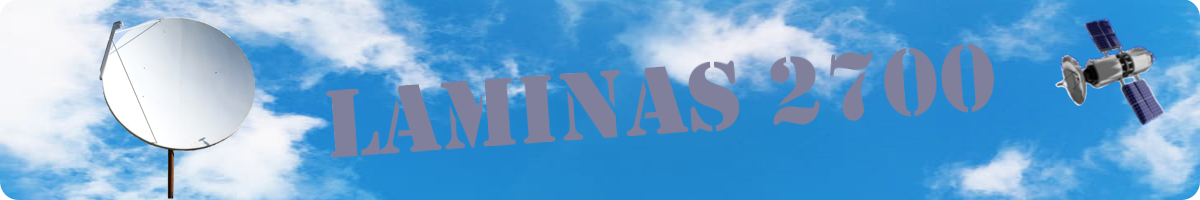
Fig. 1 - Progress of signal strength
And here we finally have the result. The first lesson that the created graph brought me was "One measurement - no measurement.". If you look carefully at the graph, you will surely notice that at midnight on 15/04/2021 the signal was already usable, while at midnight of the following day it was completely zero. This means that no big conclusions can be drawn from this chart. He's just interesting. At least for me it certainly is. He tells me that ± around 6 p.m. I can most likely say goodbye to FreeSport and at least until midnight.
The most interesting place is the time in the morning between 7:40 ÷ 8:45, when the signal usually drops to zero. I enlarged this part into a separate chart. What is interesting is the speed with which the signal drops and then picks up again. At the beginning of the window, the signal will decrease to about 2.5 dB within 3 minutes, and at the end of the window, it will rise from zero to an acceptable value in less than three minutes. I think I've read about this outage before on other sites. But before I made this graph, I was practically unaware of it, because I usually can't pay attention to satellite reception at this time.
At the end, I am adding an overview graph of the weather at the time of measurement. I don't see any major anomaly at 7:40 ÷ 8:45, when the signal drops out. It probably won't be related to the weather. More like some satellite activity. Well, in any case, this result has piqued my curiosity, and I will definitely take more measurements.
21.4.2021 supplement
Astra 2E, 11427 MHz, V, 8/9, 29500, QPSK
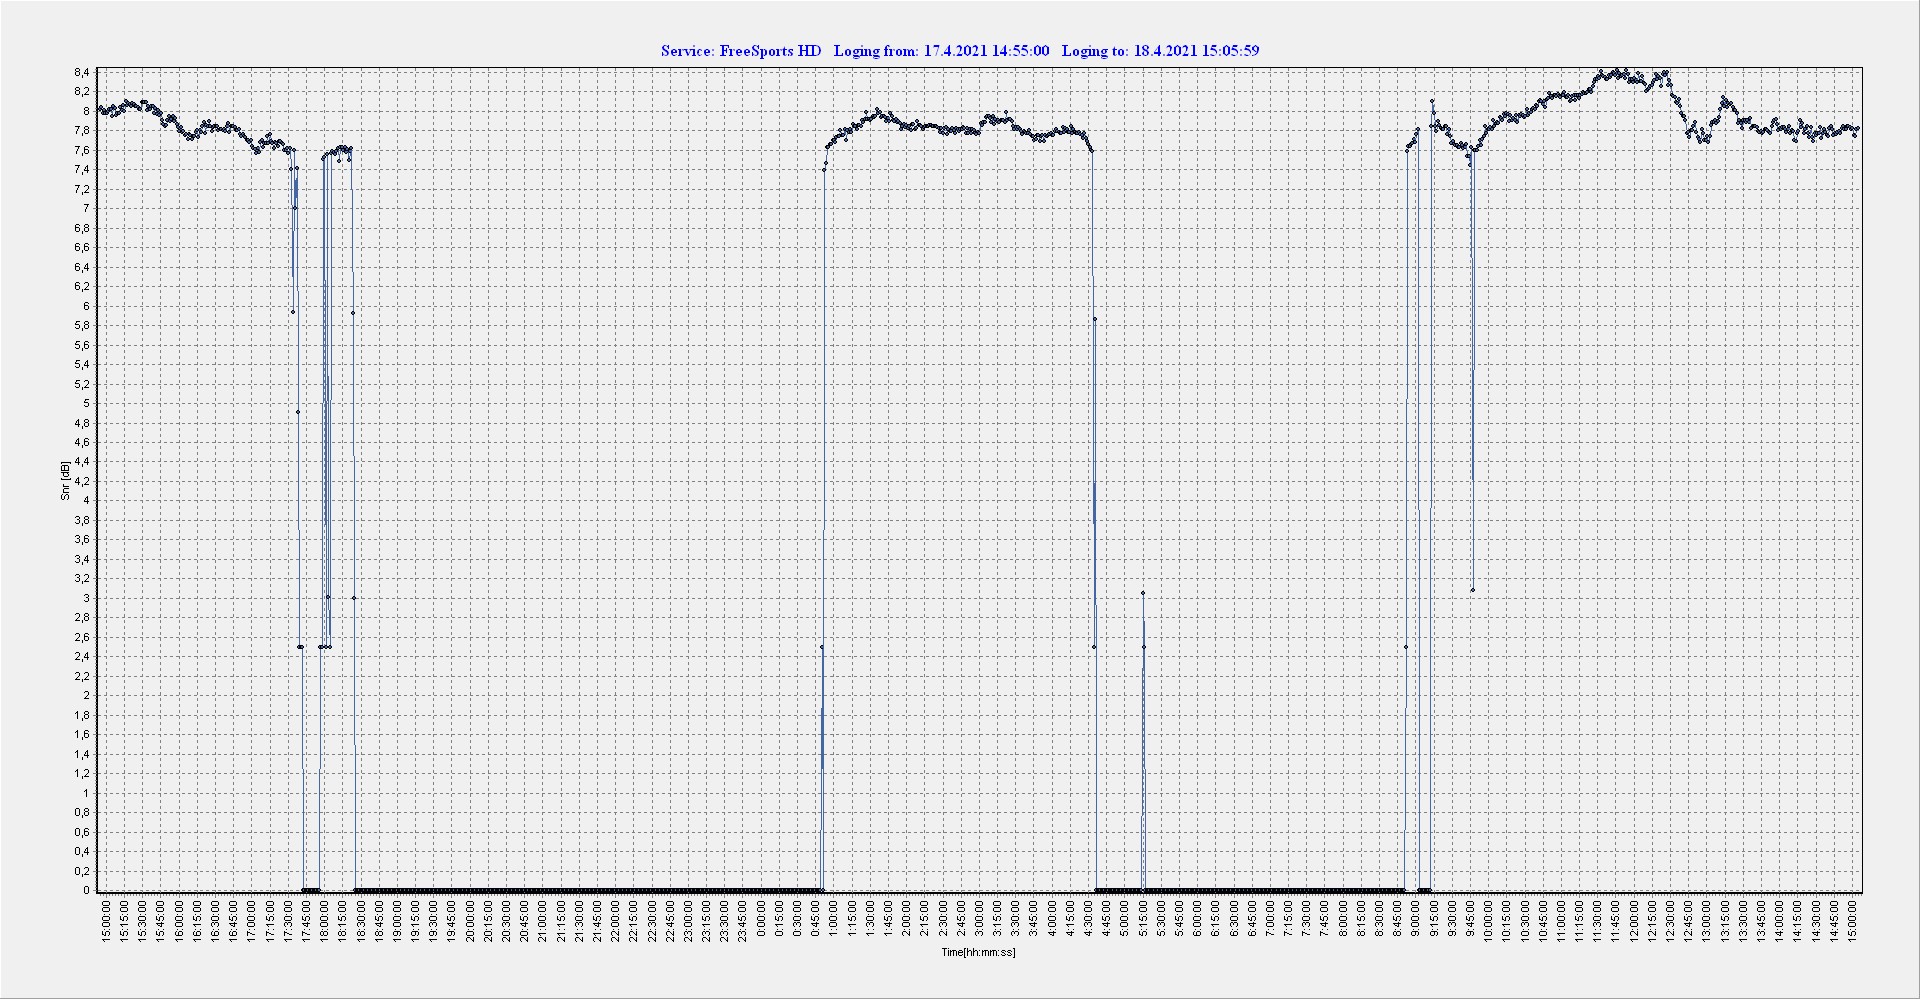
Fig. 4 - Progress of signal strength
So I finally got around to posting the second measurement. Same transponder, same program. Time loop from 15:00 to 15:00 to see the total nighttime blackout.
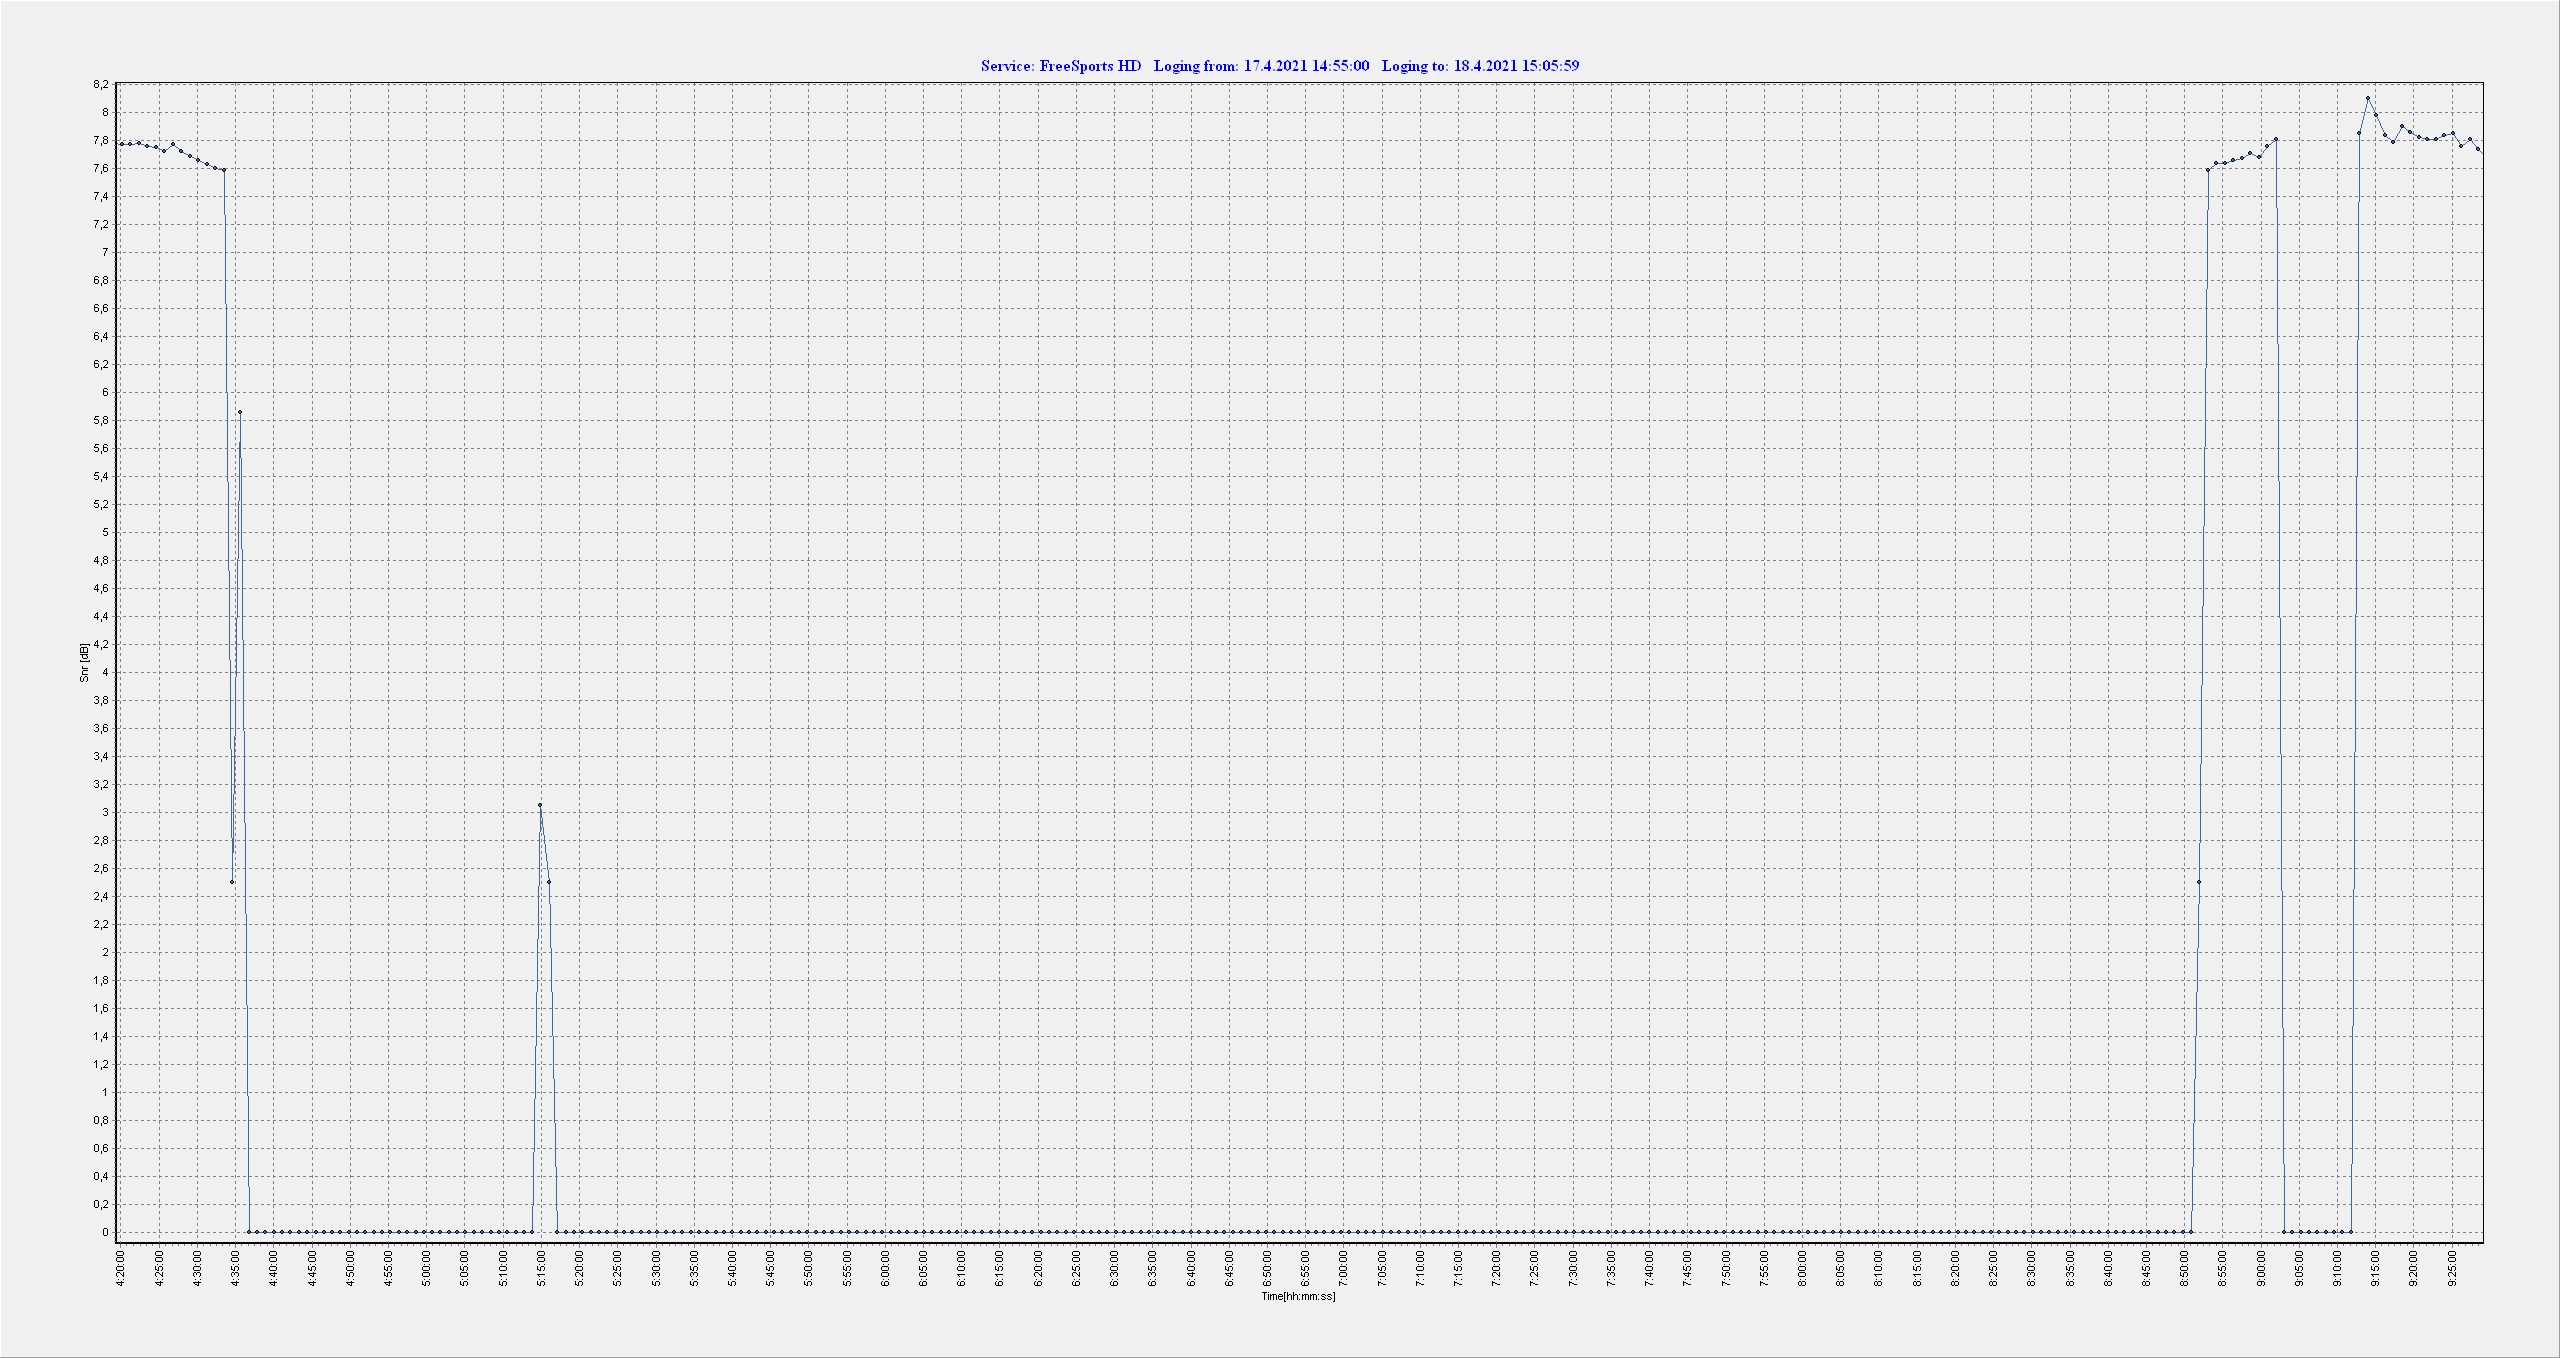
Ranní nulové okno je delší, než při prvním měření. Myslím si, že za to může větší oblačnost. Ale konec a nástup signálu je zase dost rychlý.